Bigger Truck, More Muck
More and more of our clients are looking to introduce larger equipment underground.
The immediate benefits are clear – more muck per truck means more tons per day. The real challenge is; will the new equipment fit in the existing ramps and drifts? Answering this question impacts the overall Return on Investment(ROI) and the work to put these bigger units into full operation. Understanding the effort and cost of maintenance to move utilities, venting and any other obstacles could neutralize or delay the realization of benefits.
At SafeSight we not only develop innovative solutions we also apply the technology we build to solve industry problems. Responding to this challenge was a perfect application of our SafeSight’s in motion LiDAR. HEAT MAP utility.
The Approach:
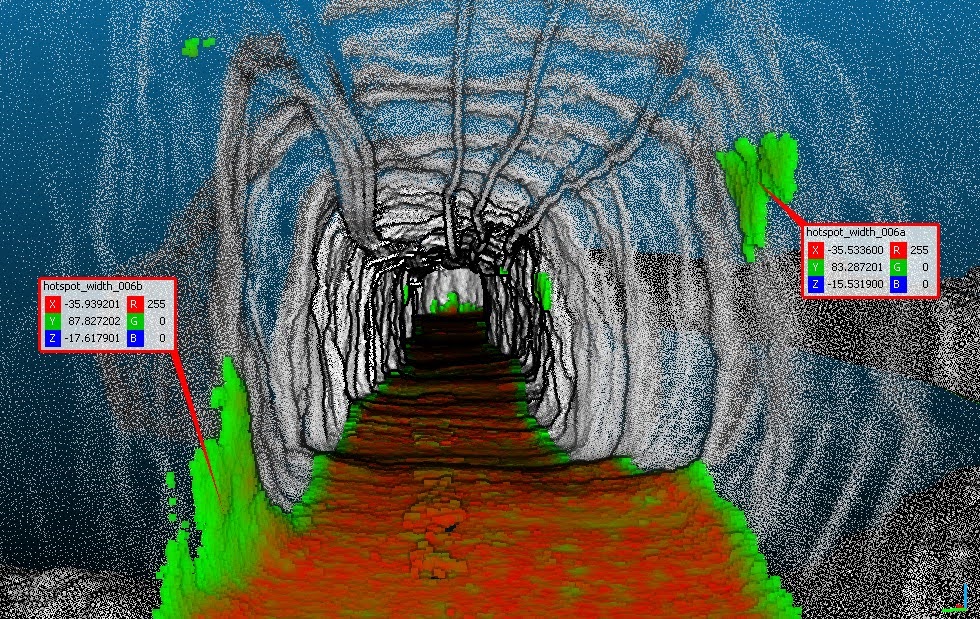
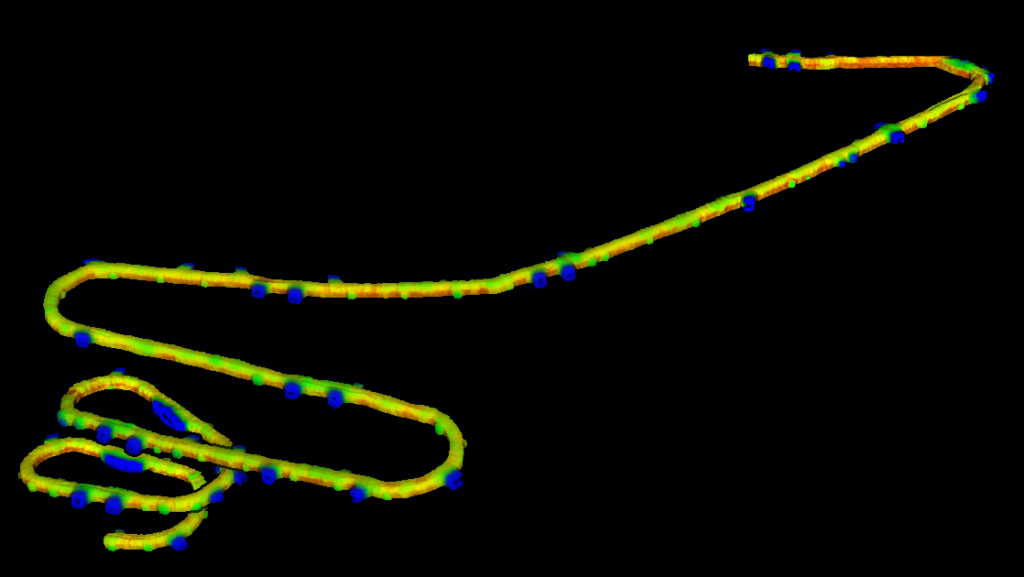
The easy part was capturing a geo-referenced scan of the target areas (Ramps, drifts and Shops. Using our in-motion scanner SafeSight is able to scan the areas quickly with minimum impact to operations.
With a 3D model construct the next requirement is to render a model of the target equipment. The model needs to reflect load and unload configurations as well as calculate the turning radius in each instance.
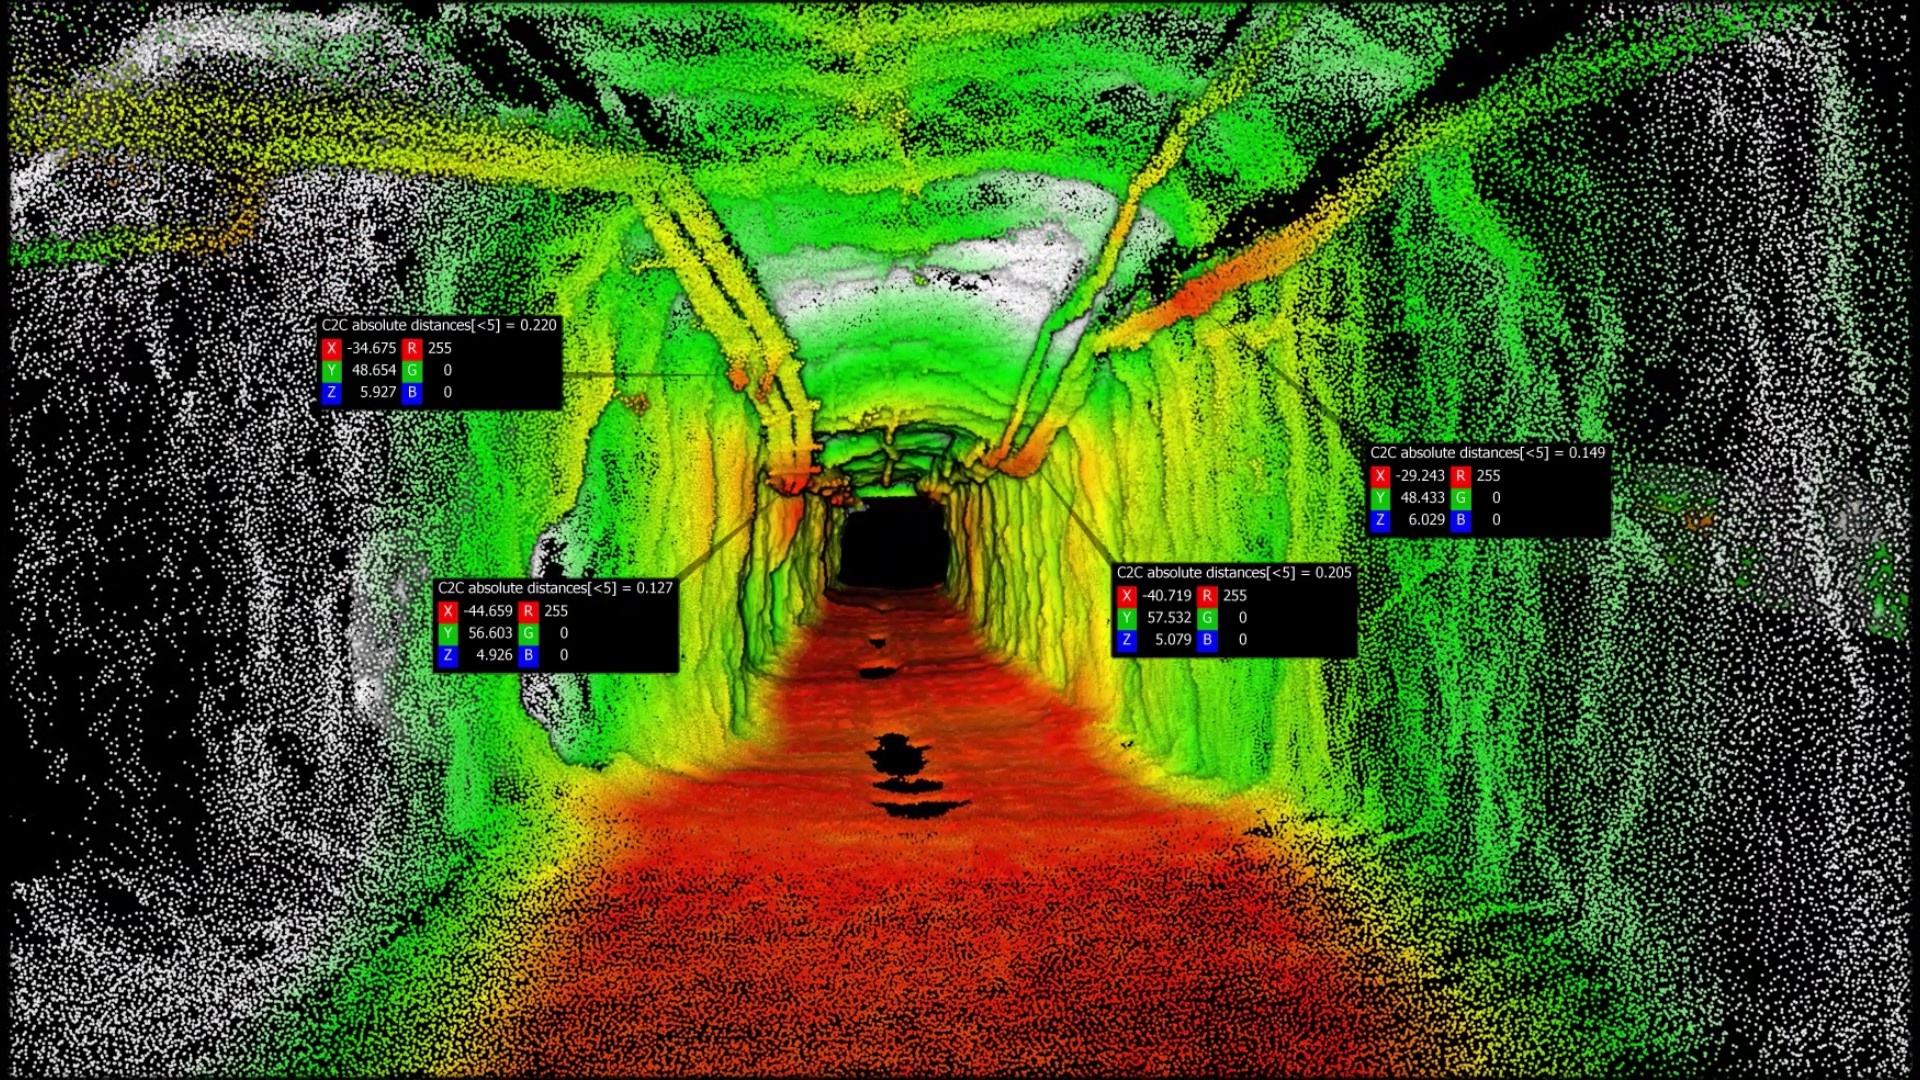
We work with the client to identify the tolerance levels for the impact assessment regarding possible maintenance points. For example this means identifying how close to “contact” would be considered as:
- RED = contact
- YELLOW = within 3 cm
- GREEN. > 3 cm from contact
The two models are then sliced into small segments and each segment is assessed against the Client defined tolerances.
Results:
This data will support the production of a HEAT MAP to support work order and maintenance estimates.
Once the data is collected, our team uses utilities to overlay equipment dimensions (blue construct) on slices of the 3D model created by SafeSight’s SafeScanner.
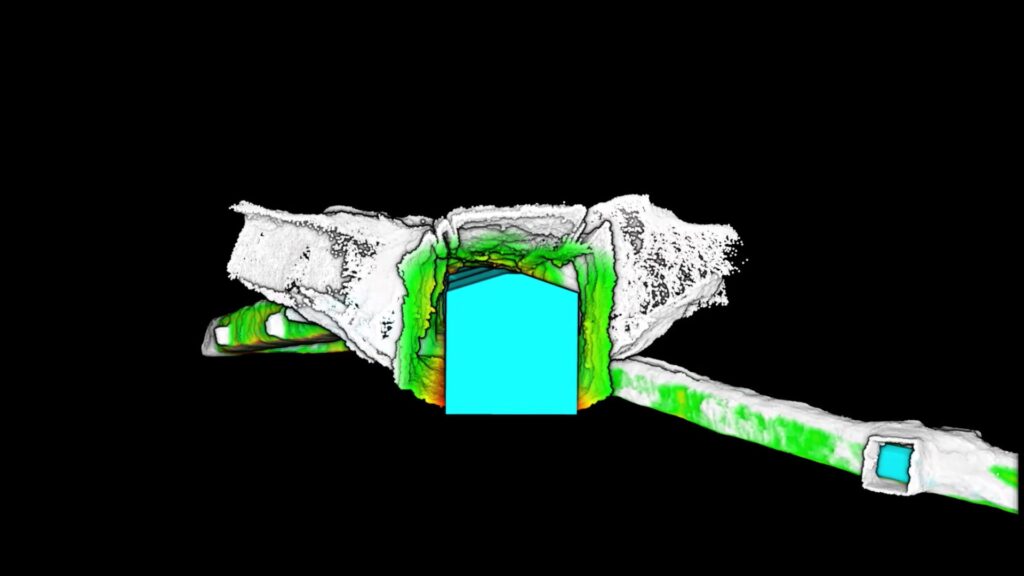
The result is a visual “heat map” is produced and identifies collision and near miss points. Red, yellow and green reflect proximity values set by the client. This data can be attached to maintenance work orders and used to visually confirm the details and develop estimates for remediation.